Highways in the Sky
A data visualisation by easypeasy-analytics
Highways in the Sky
From small talk to 3D Airspace video

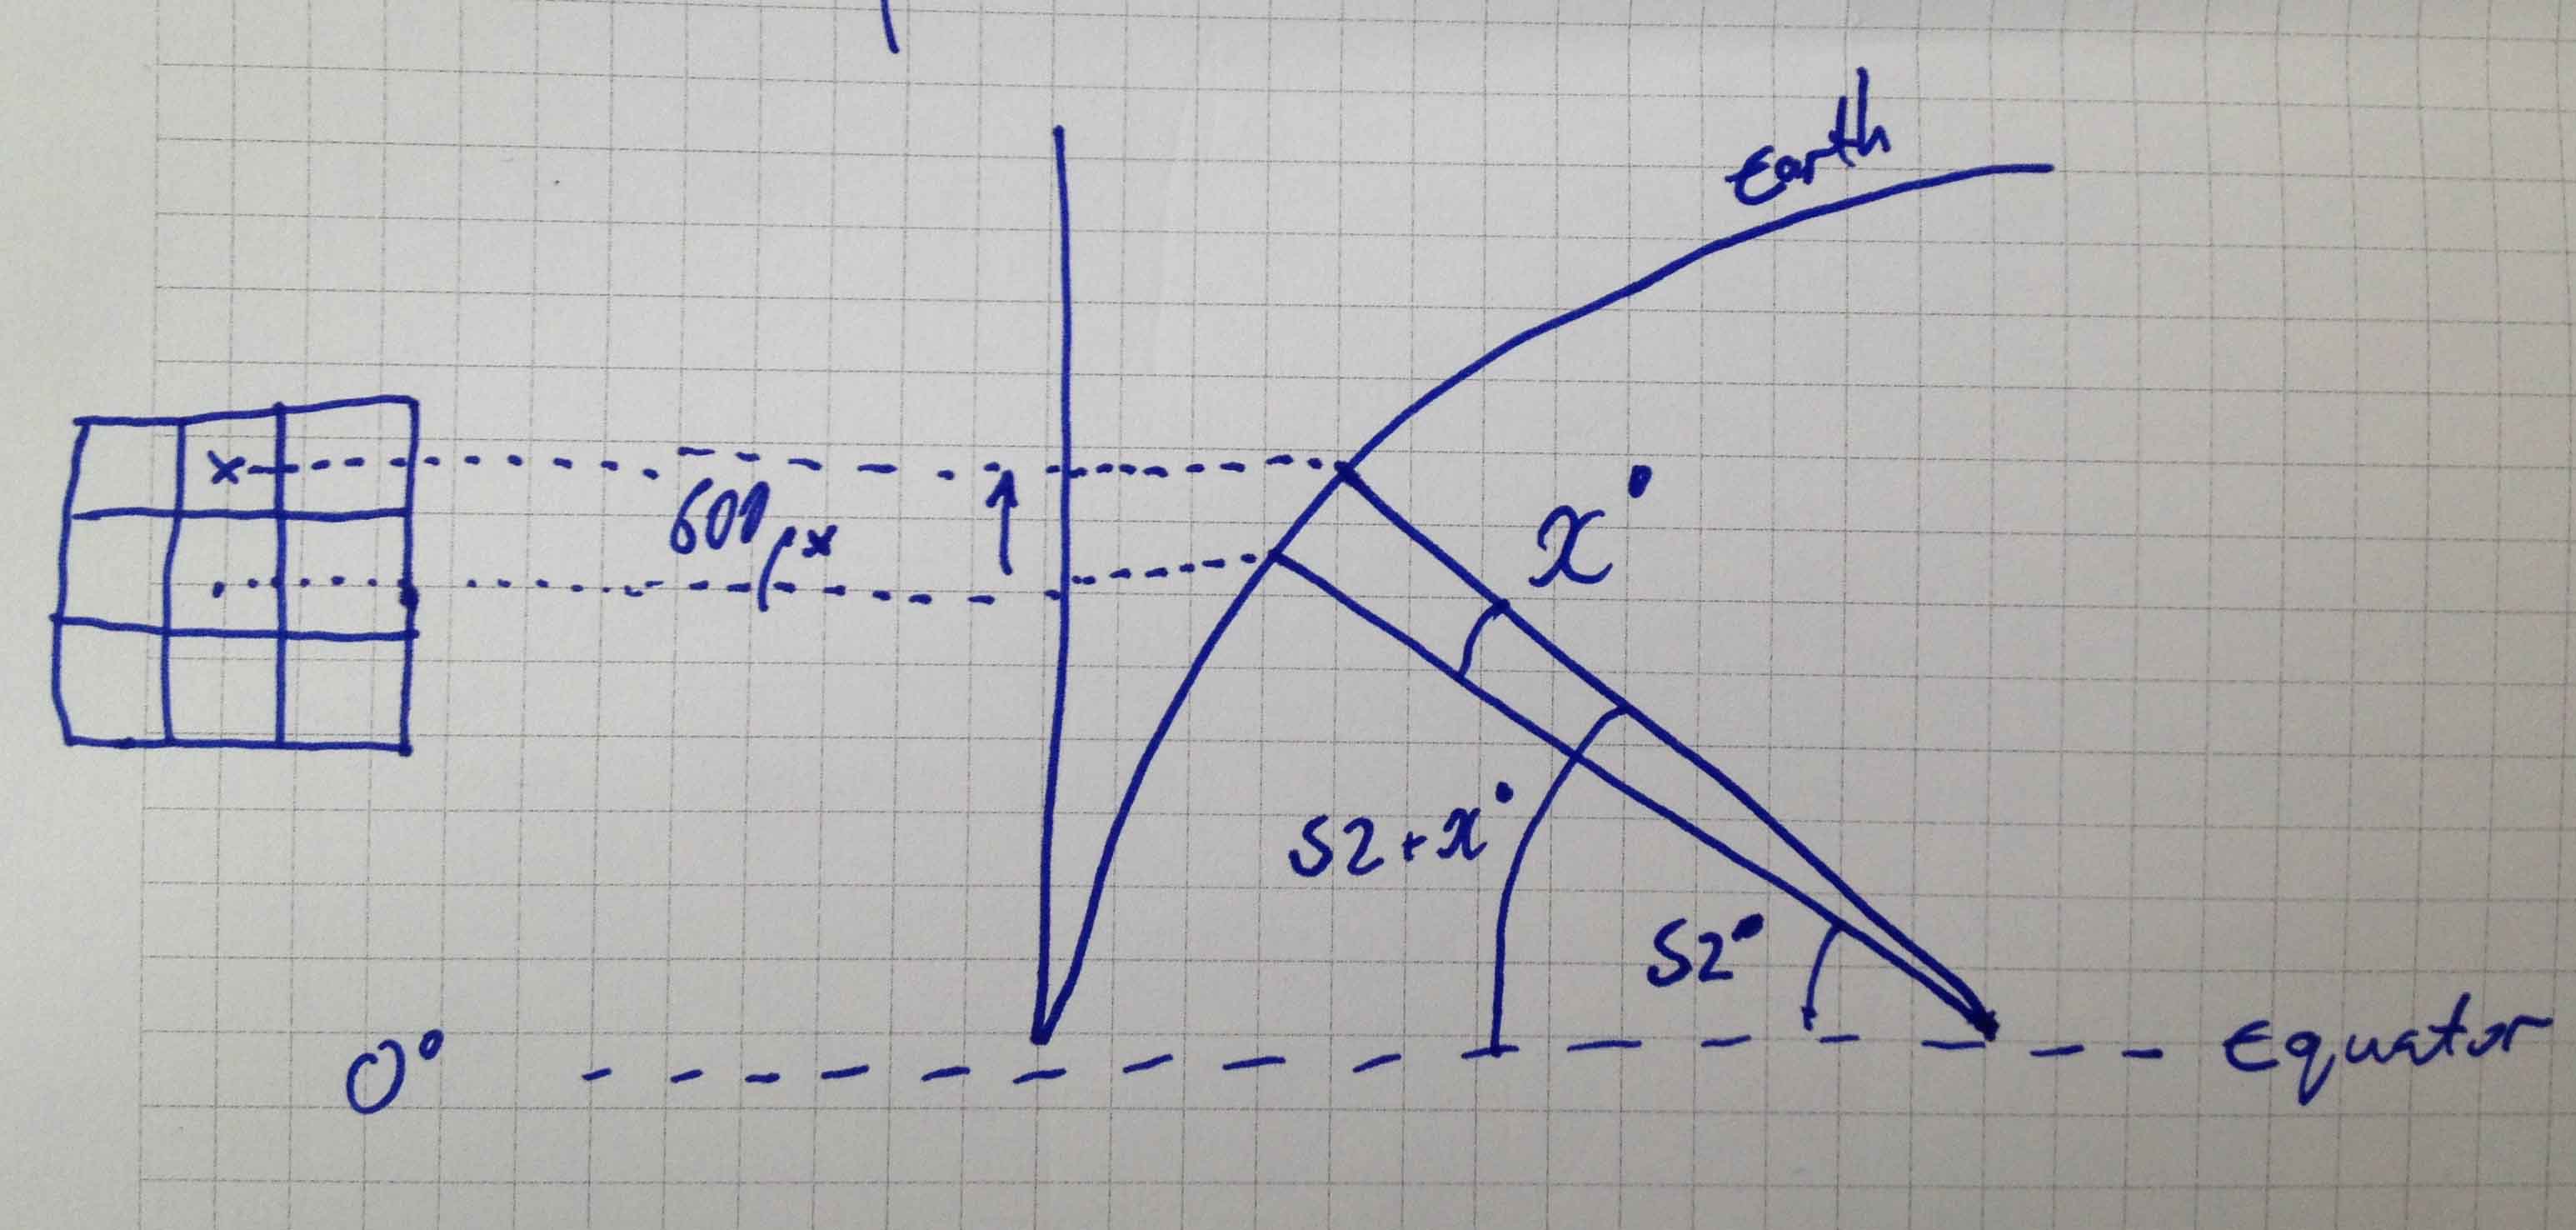
Well, one thing lead to another and here we are; Ali did a little research and found out that there is an API that provides real time location of planes, it sounded quite simple just to plot it using Visual Python for a quick demo. When he did, we discovered the beauty hidden in data, like the messy air space above London and the almost perfect Atlanta corridors. At that point we thought that it would be worth to go one step further and share it.
How To:

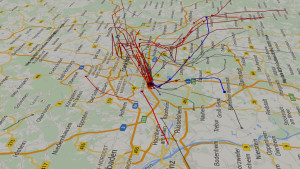
Highway lanes at Atlanta
Try For Yourself:
Highways_in_the_Sky_Raw_data.zip – raw data covering 30 mins of traffic over London (Original JSON format)
Useful References:
Learn Python through public data hacking – youtube – great intro to python with a couple of fun cases
Google developers static maps api documentation – all you need to know about static maps
Recent Videos
Recent Posts

Hottest skills of 2014 that will get you hired
Hot Skills Statistical Analysis and Data mining universally top the board of the skills that will get you hired in a study by LinkedIn. Having recently made a move myself towards a data focused position I can personally vouch for these results! See the...

Companies Want MBAs Who Can Code
Companies are increasingly reliant on data for the answers to questions and are less influenced by the blah blah blah and gut feelings of "that person who is louder and uses big fancy business words". The people looking into the data are most likely to start...
Highways in the Sky – Destination London
An Airport Under Pressure The National Air Traffic Control Services (NATS) in the United Kingdom announced recently that they now have a new system to squeeze more flights into London’s Heathrow Airport, which currently operates at...
Highways in the Sky
See what happens when you mix curiosity with a generous dose of computer wizardry. A playtime project to show beauty hidden in data.
Gallery
-
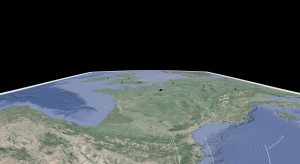
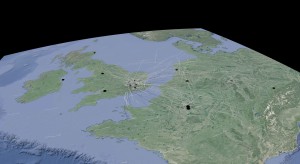
- European airspace from a distance
-
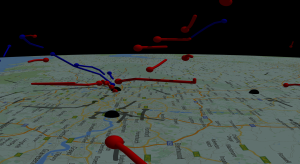
- Arrivals and departures at Atlanta
-
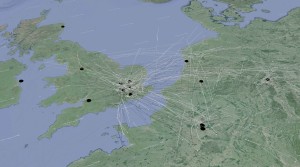
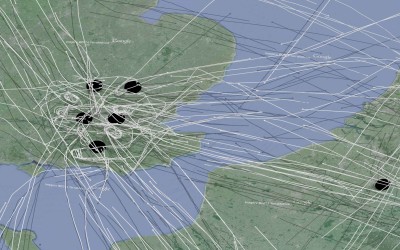
- Cross channel traffic pattern
-
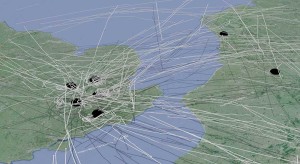
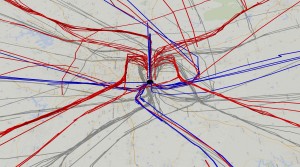
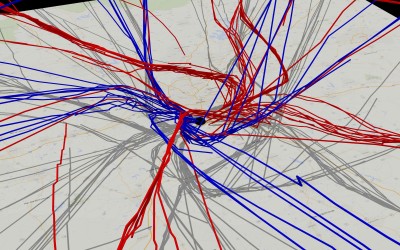
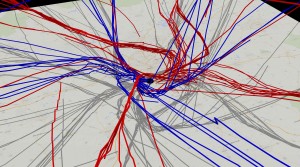
- Early morning holding over London

-
- Early morning holding over London
-
- Highway lanes at Atlanta
-
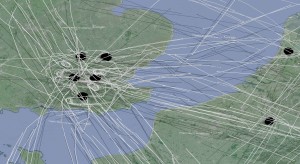
- Northern European airspace